Multilevel modeling (MLM), also known as hierarchical linear modeling (HLM) or mixed-effects modeling, is a statistical technique used to analyze data with a nested or hierarchical structure—where observations are grouped within higher-level units. Think of students nested within classrooms, patients within hospitals, or repeated measurements within individuals. Traditional statistical methods like linear regression assume all observations are independent, but in hierarchical data, units within the same group (e.g., students in one classroom) often share similarities that violate this assumption. MLM addresses this by explicitly modeling both the variation within groups (level 1) and between groups (level 2 or higher), allowing for more accurate and nuanced insights.
The core idea of MLM is to split the analysis into multiple levels, each with its own set of predictors and error terms. For example, in a study of student test scores, level 1 might model individual student factors (e.g., study hours), while level 2 models classroom factors (e.g., teacher experience). The model combines fixed effects—parameters assumed constant across the population, like the overall effect of study hours—and random effects, which allow group-specific variations, like how the effect of study hours differs by classroom. Mathematically, a simple two-level model might look like this:
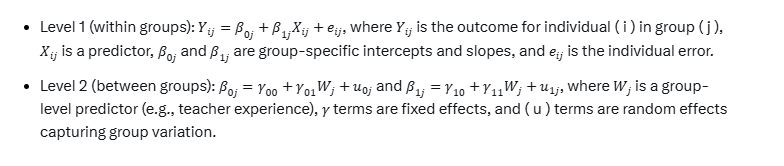
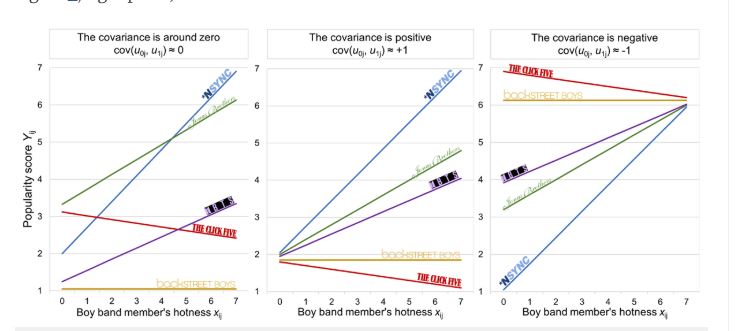
This setup allows the intercept and slope to vary randomly across groups, reflecting real-world clustering. The “mixed” in mixed-effects refers to combining fixed and random components, estimated together using methods like maximum likelihood or restricted maximum likelihood (REML).
MLM shines in its flexibility and applications. It’s widely used in education to study how school policies affect student outcomes, accounting for classroom clustering. In psychology, it handles longitudinal data—like mood scores measured repeatedly per person—capturing both individual trends and overall effects. In health, it might analyze patient recovery rates across different hospitals. Key advantages include handling unequal group sizes, missing data (to an extent), and cross-level interactions (e.g., how teacher quality modifies the effect of student effort). It also provides variance components, showing how much of the outcome’s variability lies within versus between groups—crucial for understanding context.
However, MLM isn’t without challenges. It requires sufficient data at each level (e.g., enough groups and observations per group) for reliable estimates, and model complexity grows with additional levels or random effects, demanding computational power and careful specification. Assumptions like normality of residuals and random effects still apply, though robust variants exist. Compared to simpler methods, MLM’s strength is its realism: by respecting data hierarchy, it avoids underestimating standard errors (a pitfall of ignoring clustering) and offers richer interpretations, making it a go-to for researchers tackling nested structures in the real world.