Drummond Geometry is a technical analysis trading method developed by Canadian trader Charles Drummond, beginning in the 1970s and evolving over decades. It focuses on identifying high-probability trading areas by establishing support and resistance zones across multiple time periods. The approach combines geometric patterns, short-term trend lines, and moving averages to predict market behavior and guide trading decisions.
Key components include:
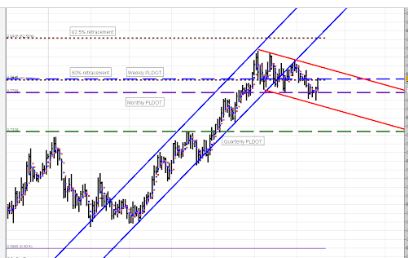
- PL Dot: A short-term, 3-period displaced moving average calculated using the high, low, and close of a price bar, designed to reflect trend direction and volatility sensitively.
- Trend Lines: Short-term lines based on two-bar configurations to project immediate support and resistance levels.
- Trading Envelope: Two bands around the PL Dot that define a range of potential price movement.
- Multi-Timeframe Analysis: Coordination of these elements across at least three timeframes (e.g., daily, weekly, monthly for swing traders; or 15-minute, hourly, daily for intraday traders) to align short-term and long-term market perspectives.
The method is used to pinpoint where prices are likely to find support or resistance, helping traders anticipate reversals or continuations. It’s adaptable to various markets and timeframes, from rapid tick charts for short-term traders to quarterly charts for long-term position traders. Drummond Geometry has evolved with additional tools like the “Pipes” indicator, blending momentum with traditional elements, and is supported by statistical evidence suggesting its effectiveness in predicting key price levels.