A probability density function (PDF) is a simple way of showing how likely different values are within a continuous range of possibilities. In everyday terms, it tells you where values tend to gather and where they are rare when the outcome can be any number within an interval rather than a fixed set of choices.
Imagine spreading sand along a table. Some areas have thick piles while others have only a little sand. The height of the sand at any point represents how common values around that point are. A probability density function works the same way — taller parts of the curve mean values near there happen more often, while lower parts mean they are less common.
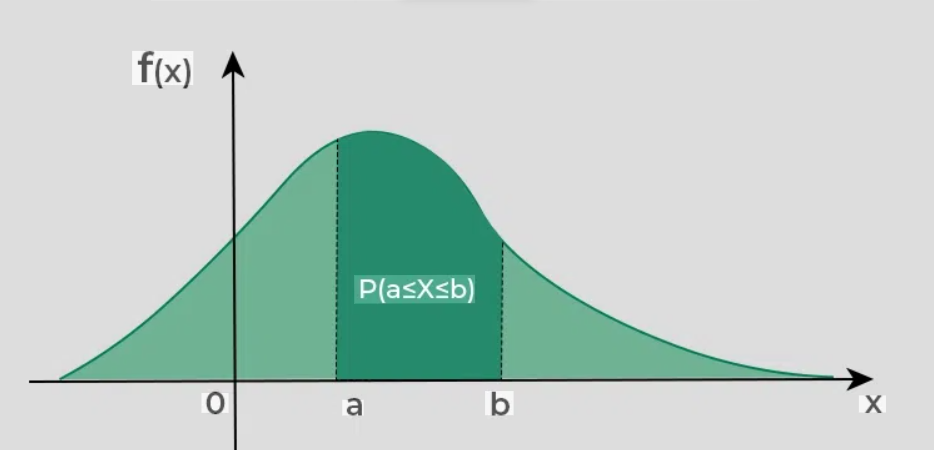
Unlike simple probabilities (like flipping a coin), a PDF does not give the probability of one exact value, because with continuous data an exact value is extremely precise and has almost zero chance by itself. Instead, it helps you find the probability of a range of values, such as between 10 and 15 rather than exactly 12.
The total area under the PDF curve always equals 1, which represents 100% of all possible outcomes. By measuring the area under part of the curve, you can determine how likely it is for the variable to fall within that region.
In short, a probability density function is just a smooth curve that shows where values are concentrated and how outcomes are spread out when dealing with measurements like height, temperature, time, or speed. It turns continuous uncertainty into something we can visualize and calculate.