Moyoglobin is an iron and oxygen-binding protein found in the muscle tissue of vertebrates in general and in almost all mammals. Myoglobin has a very high affinity for oxygen and acts as an oxygen molecule. It only releases oxygen when the partial pressure of oxygen has fallen drastically.
Hemoglobin on the other hand is the protein molecule in red blood cells that carries oxygen from the lungs to the body tissues and returns carbon dioxide from tissues to the lungs. The oxygen dissociation curve for hemoglobin has a sigmoid shape because of the co-operative binding of oxygen to the 4 polypeptide chains. On the other hand, Myoglobin is made up of a single polypeptide with only one heme group and hence is not capable of cooperative binding. Consequently, the oxygen dissociation curve for myoglobin is not sigmoidal but it is hyperbolic in shape. In this article, find an elaborate explanation on how the two curves emerge.
Hemoglobin Oxygen Dissociation Curve

Hemoglobin dissociation curve also known as oxyhemoglobin dissociation curve, is a graph that plots the proportion of hemoglobin in its saturated (Oxygen-laden) form on the vertical axis (Y-axis) against the prevailing oxygen tension (partial pressure of oxygen in blood) on the horizontal axis (x-axis). This graph is a very needful tool for understanding how our blood carries and releases oxygen.
In red blood cells, the oxygen-binding curve for hemoglobin presents an ‘’S’’ shape known as sigmoidal curve. A sigmoidal curve shows that oxygen binding is cooperative. Co-operative binding means that hemoglobin has a greater ability to bind oxygen after a subunit has already bound oxygen. Hemoglobin is, therefore, most attracted to the oxygen when 3 of the 4 polypeptide chains are bound to oxygen.
The interpretation of the sigmoid curve hemoglobin’s affinity for oxygen increases as successive molecules of oxygen bind. More molecules bind as the oxygen partial pressure increases until the maximum amount that can be bound is reached. As this limit is approached, very little additional binding occurs and the curve levels out as the hemoglobin becomes saturated with oxygen. Hence the curve has a sigmoidal or S-shape.
At pressures above 62 mmHg, the standard dissociation curve is relatively flat, which means that the oxygen content of blood does not change significantly even with large increase in the oxygen partial pressure. For tissues to get more oxygen, it would require blood transfusion to increase the oxygen carrying capacity (hemoglobin count) or additional oxygen that would increase the oxygen dissolved in plasma. Although binding of oxygen to hemoglobin continues to some extend for pressures about 50 mmHg, as oxygen partial pressures decrease in this steep area of the curve, the oxygen is unloaded to peripheral tissue readily as the hemoglobin’s affinity diminishes.
Myoglobin Oxygen Dissociation Curve

Myoglobin is an oxygen-binding molecule that is found in skeletal muscle tissue. Myoglobin is made up of a single polypeptide with only one heme group and hence is not capable of cooperative binding. Consequently, the oxygen dissociation curve for myoglobin is not sigmoidal but it is hyperbolic in shape.
Myoglobin has a higher affinity for oxygen than adult hemoglobin and becomes saturated at lower oxygen levels. Myoglobin will hold on to its oxygen supply levels in the muscle are very low (for example during intense physical activity). The delayed release of oxygen helps to slow the onset of anaerobic respiration and lactic acid formation during exercise.
What Factors Affect the Standard Oxygen Dissociation Curve?
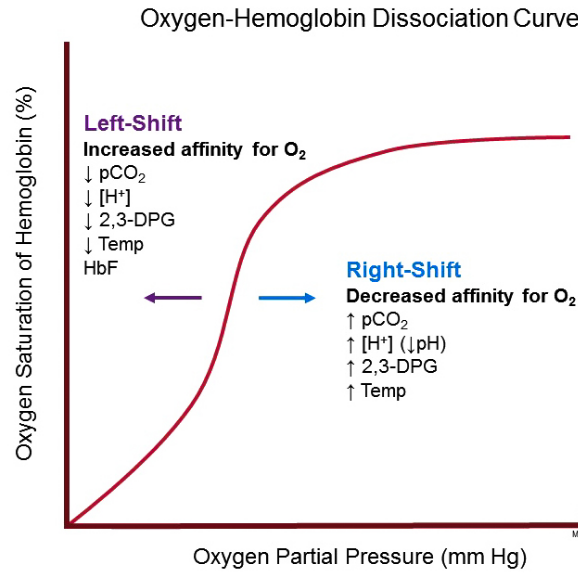
Oxygen dissociation curve of hemoglobin has been studied widely and mathematically described for many years now. There are several factors which will always affect the strength with which oxygen binds to hemoglobin. These factors can shift the curve rightward or leftward. Rightward shift indicates that the hemoglobin under investigation has a decreased affinity for oxygen whereas a leftward shift indicates that hemoglobin under investigation has an increased affinity for oxygen. These factors include:
Temperature
A decrease in temperature shifts the curve to the left while an increase in temperature shifts the curve to the right. When temperature increase, the bond between oxygen and hemoglobin gets denatured and this increases the amount of oxygen and hemoglobin and decreases the concentration of oxyhemoglobin. It is usually difficult to notice the effect of temperature, but in cases of hypothermia or hyperthermia, the effects are clearly noticeable.
Organic Phosphates
2, 3-Diphospoglycerate (2,3-DPG) is the main primary organic phosphate. An increase in 2, 3-DPG shifts the curve to the right while a decrease in 2,3-DPG shifts the curve to the left. 2, 3-DPG binds to hemoglobin and rearranges it into the T state, which decreases its affinity for oxygen.
PH
An increase in PH shifts the curve the left whereas a decrease in PH shifts the curve to the right. This happens because a higher hydrogen ion concentration causes a change in amino acid residues that stabilizes deoxyhemoglobin in a state known as (the T-State), that has a lower affinity for oxygen. This rightward shift is known as Bohr Effect.
Carbon Dioxide (CO2)
An increase in CO2 shifts the curve to the right whereas a decrease in CO2 shifts the curve to the left. Hemoglobin binds with CO2 more readily than oxygen. Accumulation of CO2 results to formation of Carbamino compounds which then binds to oxygen to form carbaminohemoglobin which then stabilizes deoxyhemoglobin in the T state. Also, accumulation of CO2 causes an increase in hydrogen ion concentration and a decrease in PH and consequently shifts the curve to the right.
Factors Affecting Oxygen Dissociation Curve in Tabular Form
| FACTORS | INCREASE | DECREASE |
| PH | Left shift | Right shift |
| CO2 | Right shift | Left shift |
| Temperature | Right Shift | Left shift |
| 2,3-DPG | Right shift | Left shift |
Summary
What is the main difference between hemoglobin and myoglobin oxygen dissociation curve?
Hemoglobin oxygen dissociation curve is Sigmoidal in shape whereas the myoglobin oxygen dissociation curve is hyperbolic in shape.