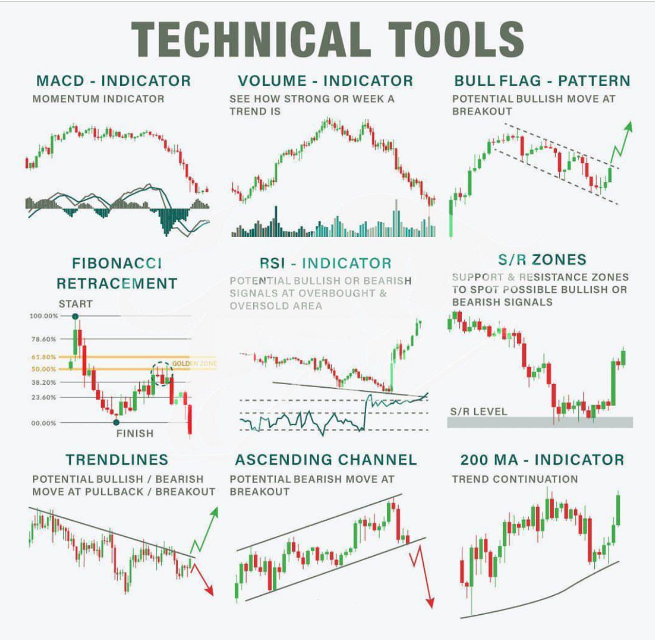
There are 3 primary trading tools used in technical analysis for identifying entry and exit signals.
- Drawing Tools
- Chart Patterns
- Technical Indicators
How Are Drawing Tools Used In Trading?
Most charting platforms have drawing tools that allow a trader to draw their own trendlines directly on a chart and create trend channels to track the momentum of a trend, with peaks (or highs) frequently respecting the upper trend channel; and troughs (or lows) respecting the lower channel.
A trader can project Fibonacci extension levels from a present trend and also project Fibonacci retracement levels from an existing trend.
Drawing tools also allow the creation of captions to highlight buy and sell signals and record your observations on the chart.
Trendlines are the identifiers and connectors of resistance and support in chart patterns.
Trendlines are ways to measure and quantify the path of least resistance for a chart in your time frame.
Trendlines are identifiers of the trend in your trading time frame.
Vertical trend lines must be drawn from left to right to identify one of the following:
- A trend of higher highs signaling an uptrend.
- A trend of higher lows for support in an uptrend.
- A trend of lower lows signaling a downtrend.
- A trend of lower highs for resistance in a downtrend.
Horizontal trend lines must be drawn straight from left to right to identify price levels of resistance based on repeating high prices that can’t be broken or levels of support based on repeating lows that hold
Trend lines can connect end of day prices or the full daily range of prices. For candlestick charts the wicks represent intra-day prices that were outside the open or the close. Both are viable options for trend lines
Trend lines should connect at least two price levels in a direct path to be considered viable. The more connections that a trend line makes the more meaningful it is
Trend lines must be updated daily to ensure a trend is still in place. You want to see a connection and trend of prices in your timeframe
A break out of price through your connecting trend line can indicate the beginning of a change in trend or market environment. A market could be going from an uptrend or downtrend to a sideways range as your trend line breaks or reversing in trend completely
Price channels can be: up, down, or sideways.
There are uptrend, downtrend, and range bound price channels.
Chart patterns are visual representations of price action. Chart patterns can show trading ranges, swings, trends, and reversals in price action. The signal for buying and selling a chart pattern is usually a trend line breakout in one direction showing support or resistance is overcome at a key level. Stop losses are usually set on retracements back inside the previous range and profit targets are usually set based on the magnitude of the previous move leading into the pattern
Many people think of chart patterns as bullish or bearish but there are really three main types of chart pattern groups: reversal chart patterns, continuation chart patterns, and bilateral chart patterns. Understanding the differences are important for traders to understand the path of least resistance on a specific chart based on the primary sentiment of the buyers and sellers price action
The MACD is not bounded inside set parameters so it’s not a good tool for identifying extended overbought of oversold price levels. It is a trend and momentum indicator and shows the current direction of a move. Traders can wait for signal line crossovers, center line crosses, and divergences as potential trading signals.
The RSI is used to measure the magnitude and speed of price moving in one direction on a chart. RSI readings are on a scale from 0 to 100 but over 90% of the readings will usually fall inside the 30-70 range on most charts. RSI readings below 30 indicate that the stock is likely oversold and RSI readings above 70 indicate that the odds are a chart is overbought.