
The Heikin-Ashi Technique is a charting method used in technical analysis to smooth out price data and highlight trends more clearly than traditional candlestick charts. Originating from Japan (“Heikin-Ashi” translates to “average bar” in Japanese), it modifies raw price data—open, high, low, close (OHLC)—into a format that filters noise, making it easier to spot trend direction, strength, and potential reversals. It’s particularly popular among traders in markets like stocks, forex, and cryptocurrencies, where short-term price fluctuations can obscure the bigger picture.
Unlike standard candlesticks, which plot actual OHLC values, Heikin-Ashi candles use averaged values derived from both current and prior price action. This averaging creates a smoother visual representation, emphasizing momentum and reducing the choppiness of volatile markets. Traders use it to:
- Identify trends (uptrends show consecutive green candles, downtrends show red).
- Spot reversals (small-bodied candles or dojis often signal trend exhaustion).
- Confirm momentum with other indicators like moving averages or RSI.
Formula
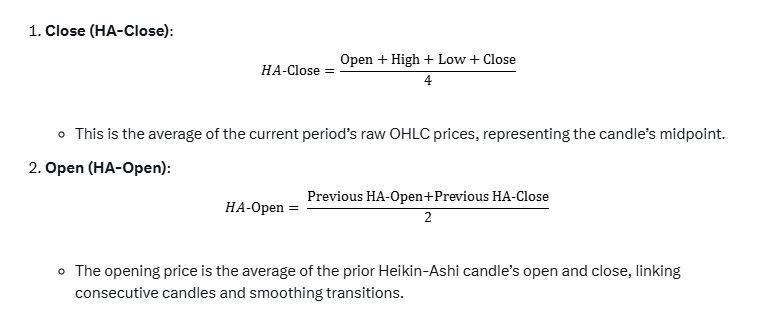
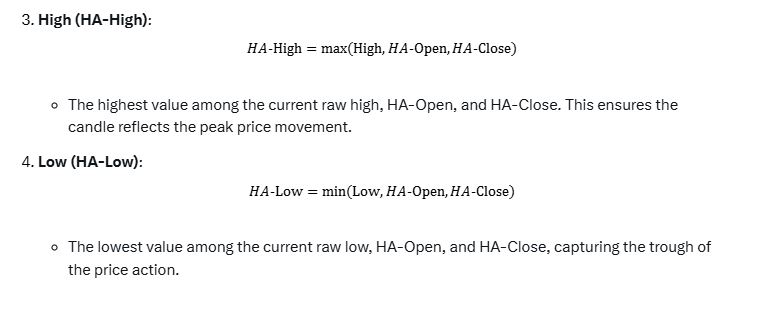
Heikin-Ashi candles are calculated using the following formulas, applied iteratively for each candle based on the current period’s raw OHLC data and the prior Heikin-Ashi candle’s values. Here’s how each component is derived:
Step-by-Step Calculation
To illustrate, let’s walk through an example with two periods of raw price data:
- Period 1: Open = 100, High = 105, Low = 98, Close = 102
- Period 2: Open = 102, High = 107, Low = 101, Close = 106
First Heikin-Ashi Candle
For the first candle, since there’s no prior HA data, traders often use the raw values or approximate:
- HA-Close = (100+105+98+102)/4=101.25
- HA-Open = ( 100 ) (or average of raw open and close: (100+102)/2=101(100 + 102) / 2 = 101
(100 + 102) / 2 = 101, depending on preference). - HA-High = max(105,100,101.25)=105
- HA-Low = min(98,100,101.25)=98
Second Heikin-Ashi Candle
Now use Period 2’s raw data and Period 1’s HA values:
- HA-Close = (102+107+101+106)/4=104
- HA-Open = (100+101.25)/2=100.625(100 + 101.25) / 2 = 100.625
(100 + 101.25) / 2 = 100.625(using first candle’s HA-Open and HA-Close) - HA-High = max(107,100.625,104)=107
- HA-Low = min(101,100.625,104)=101
These values form the second HA candle, and the process continues for subsequent periods.
Interpretation
- Uptrend: HA candles have no lower shadows (wicks), with HA-Close above HA-Open (typically green), showing sustained buying pressure.
- Downtrend: No upper shadows, HA-Close below HA-Open (typically red), indicating selling dominance.
- Reversal Signals: Small bodies or dojis (where HA-Open ≈ HA-Close) suggest weakening momentum, often after a strong trend.
- Consolidation: Choppy, small candles with shadows on both ends signal indecision.
Practical Use
- Trend Following: Pair with a moving average (e.g., 50-period). If HA candles stay above the MA with no lower shadows, it’s a strong uptrend—time to buy or hold.
- Exit Points: A doji or reversal candle after a trend warns of a potential exit.
- Filtering Noise: Use on higher timeframes (e.g., daily) to avoid false signals in choppy markets.
Advantages
- Smoothes volatility, making trends stand out.
- Reduces emotional trading by minimizing focus on short-term price spikes.
- Works across assets and timeframes.
Limitations
- Lagging: Averaging delays real-time price reflection, so it’s less useful for scalping.
- False Signals: In sideways markets, it can misrepresent direction.
- Not Raw Data: HA prices don’t match actual market prices, so confirm with other tools.
Heikin-Ashi is a lens for traders who prioritize trend clarity over granular price action, blending simplicity with actionable insights.