The analysis of shape of data is a crucial action in statistics. It helps to understand where the most information is lying and analyze the outliers in a given data. In this article, we’ll learn about the shape of data, the importance of skewness, and kurtosis. The types of skewness and kurtosis and Analyze the major difference between Skewness and Kurtosis. Statistical concepts like Skewness and Kurtosis are critical concepts applied in the field of Data Analytics.
What is Skewness?
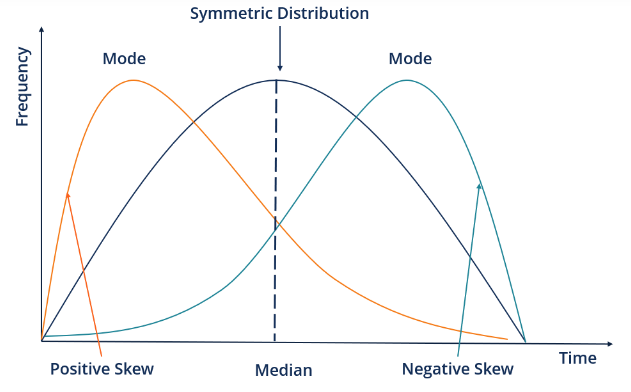
Skewness is a measure of symmetry, or more precisely, the lack of symmetry. It measures the deviation of the given distribution of a random variable from a symmetric distribution, such as normal distribution. A normal distribution is without any skewness, as it is symmetrical on both sides. Hence, a curve is regarded as skewed if it is shifted towards the right or the left.

A distribution, or data set, is symmetric if it looks the same to the left and right of the center point. Sometimes, the normal distribution tends to tilt more on one side. This is because the probability of data being more or less than the mean is higher and hence makes the distribution asymmetrical. This also means that the data is not equally distributed. The skewness can be on two types:
Positively Skewed: In a distribution that is Positively Skewed, the values are more concentrated towards the right side, and the left tail is spread out. Hence, the statistical results are bent towards the left-hand side.
Negatively Skewed: In a Negatively Skewed distribution, the data points are more concentrated towards the right-hand side of the distribution. This makes the mean, median, and mode bend towards the right.
What is Kurtosis?
Kurtosis is a measure of whether the data are heavy-tailed or light-tailed relative to a normal distribution. That is, data sets with high kurtosis tend to have heavy tails, or outliers. Data sets with low kurtosis tend to have light tails, or lack of outliers.
In other words, Kurtosis is all about the tails of the distribution — not the peakedness or flatness. It is used to describe the extreme values in one versus the other tail. It is actually the measure of outliers present in the distribution.

Tails are the tapering ends on either side of a distribution. They represent the probability or frequency of values that are extremely high or low compared to the mean. In other words, tails represent how often outliers occur.
High kurtosis in a data set is an indicator that data has heavy tails or outliers. If there is a high kurtosis, then, we need to investigate why do we have so many outliers. It indicates a lot of things, maybe wrong data entry or other things.
Low kurtosis in a data set is an indicator that data has light tails or lack of outliers. If we get low kurtosis(too good to be true), then also we need to investigate and trim the dataset of unwanted results.
Types of Kurtosis
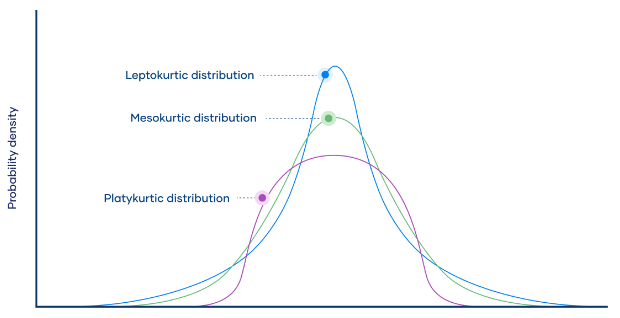
There are three types of kurtosis: mesokurtic, leptokurtic, and platykurtic.
- Mesokurtic: Distributions that are moderate in breadth and curves with a medium peaked height.
- Leptokurtic: More values in the distribution tails and more values close to the mean (i.e. sharply peaked with heavy tails).
- Platykurtic: Fewer values in the tails and fewer values close to the mean (i.e. the curve has a flat peak and has more dispersed scores with lighter tails).
Key Difference: Skewness vs Kurtosis
Conceptual Focus
- Skewness primarily quantifies the asymmetry of a distribution, indicating the degree to which the distribution is skewed to the left or right.
- Kurtosis measures the “tailedness” of a distribution, revealing the concentration of data in the tails relative to a normal distribution.
Interpretation of Values
- A positive skewness value indicates a longer tail on the right side of the distribution, suggesting more data points with smaller values. A negative skewness value indicates a longer tail on the left side, suggesting more data points with larger values.
- Positive kurtosis implies heavier tails and a more peaked center compared to a normal distribution. Negative kurtosis indicates lighter tails and a flatter peak.
Outlier Sensitivity
- Skewness is influenced by extreme values (outliers) on the longer tail, potentially skewing the measure.
- Kurtosis is particularly sensitive to extreme values in the tails, contributing to its evaluation of tailedness.
Normal Distribution Comparison
- In a perfectly symmetric normal distribution, the skewness is 0. Positive skewness deviates to the right, and negative skewness deviates to the left.
- The kurtosis of a normal distribution is 3. Distributions with higher kurtosis have more data in the tails, and those with lower kurtosis have less.
Applications
- Skewness helps identify the direction and extent of asymmetry in data, aiding in risk assessment, financial analysis, and anomaly detection.
- Kurtosis is utilized to understand the distribution’s tail behavior, assisting in identifying potential outliers, assessing model assumptions, and guiding decision-making in finance and risk analysis.
Measurement Formulas
- There are different formulas for skewness, but a commonly used one is the Pearson’s skewness coefficient, calculated as the third standardized moment.
- Kurtosis also has various formulas, and excess kurtosis is commonly used. Excess kurtosis subtracts 3 from the computed kurtosis value to make it relative to the normal distribution’s kurtosis.
Skewness vs Kurtosis: Key Takeaways
- Skewness basically measures the asymmetry in data. Kurtosis on the other hand, measures the bulge / peak of a distribution curve.
- While skewness helps in the determining if the given set of data is inclined towards a particular side (mean > mode or vice versa), kurtosis helps to determine if the curve is more or less higher as compared to the normal curve.
- Skewness is relatively easy to understand. It’s a measure of the symmetry of a distribution. A symmetric distribution has skewness of 0. A variable with a longer right tail will have positive skewness and one with a longer left tail will have negative skewness.
- Kurtosis is a statistical measure that defines how heavily the tails of a distribution differ from the tails of a normal distribution. In other words, kurtosis identifies whether the tails of a given distribution contain extreme values.
- Kurtosis is trickier to understand and some people recommend not reporting it because it is so weird. It’s a measure of the relative amount of the distribution that is in the tails rather than the center. But there is variation in the measures of kurtosis.