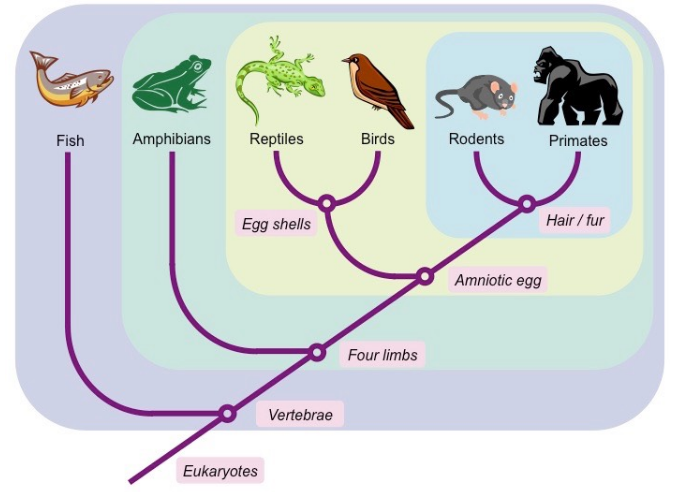
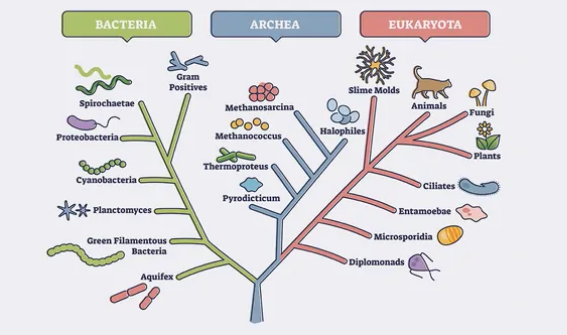
In evolutionary science, classification of living organisms is critical in understanding life’s history of group of organisms. For a very long time, scientists and researchers have tried in very many ways to represent these complex relationships in a visually informative manner and in all their trials, two methods have always emerged as the best . They are cladograms and phylogenetic trees. Though they both serve the same purpose, these two techniques differ in very many ways including in their structures and interpretations.
What Is a Cladogram?
A cladogram is a diagram used in biology and evolutionary science (cladistics) to represent the evolutionary relationships between different species or groups of organisms. It is a visual tool that hypothetically illustrates the evolutionary history or phylogeny of organisms based on their shared characteristics and common ancestry.
Well, the main role of cladograms is to show the patterns of descent and the branching relationships between different taxa (groups of organisms) as they diverge from common ancestors.
Though a Cladogram resembles a tree with branches off a main trunk, it is however not an evolutionary tree because it does not show how ancestors are related to descendants nor does it show how much they have changed; nevertheless, many evolutionary trees can be inferred from a single Cladogram.
What You Need To Know About Cladogram
Key aspects or features of a cladogram

- Nodes: These are points on the diagram where branches split, representing points of common ancestry or evolutionary divergence.
- Branches: The lines connecting the nodes, representing the evolutionary relationships between taxa. Longer branches indicate more evolutionary changes or time since divergence, while shorter branches indicate more recent common ancestry.
- Taxa: These are the groups of organisms being compared, all along from species to higher taxonomic levels like families, orders, classes, etc.
- Character states: Cladograms are constructed based on shared derived characteristics, also known as character states. These are traits or features that are unique to a specific group of organisms and their common ancestor.
Constructing a cladogram
The process of constructing a cladogram involves gathering data on the shared derived characteristics of the organisms being studied. These characteristics can be morphological (physical features), molecular (genetic information), or behavioral traits. Each characteristic is represented as a binary state (e.g. presence or absence) for each taxon.
For example, if we were constructing a cladogram for different bird species based on wing structure, we might observe that some species have feathers for flight (wing present) while others have lost their ability to fly and lack well-developed wings (wing absent).
After compiling the data, the cladogram is constructed using computational algorithms or manual analysis to determine the simplest evolutionary relationships among the taxa. The main goal here is to entirely reduce the number of evolutionary changes needed to explain the observed characteristics and produce the most logical branching pattern.
Interpreting a cladogram
Cladograms are read from the base upwards, with the base representing the common ancestor of all the taxa being studied. As you move up the cladogram, each branching point represents a divergence event, and the taxa located at the tips of the branches are the most recently evolved.
Cladograms do not convey information about the time scale of evolutionary events; they are more focused on the hierarchical relationships between taxa based on shared derived characteristics.
What is a Phylogenetic Tree?
A phylogenetic tree, also known as an evolutionary tree or tree of life, is a branching diagram that depicts the evolutionary relationships and history of different biological species or organisms based upon similarities and differences in their physical or genetic characteristics.
All life on Earth is part of a single Phylogenetic tree, indicating common ancestry. Phylogenies are useful for organizing knowledge of biological biodiversity, for structuring classifications and for providing insights into events that occurred during evolution or in general the biodiversity and evolutionary processes that have shaped the living world.
Also, Phylogenetic trees can provide information about the historical movement of organisms across geographical regions and continents.
What You Need To Know About Phylogenetic Tree
Key aspects or features of a phylogenetic tree

- Nodes: These are points on the tree where branches split, representing common ancestors or points of divergence in evolutionary history. Each node indicates a speciation event, where a single ancestral lineage gave rise to two or more distinct lineages.
- Branches: The lines connecting the nodes, indicating the evolutionary relationships between the different taxa (groups of organisms) in the tree. Longer branches imply more evolutionary changes or time since divergence, while shorter branches indicate more recent common ancestry.
- Taxa: Phylogenetic trees include the groups of organisms being studied, which can range from individual species to higher taxonomic levels like families, orders, classes, etc.
- Tips/Leaves: The terminal ends of the branches, which represent the individual taxa being compared. These are the species or groups of organisms for which data is available.
Constructing a phylogenetic tree
The process of constructing a phylogenetic tree involves gathering data on the similarities and differences among the organisms being studied. The data can be morphological (physical characteristics), molecular (genetic information), behavioral traits or any other relevant data. Molecular data, particularly DNA and protein sequences are lately being considered by many scientist because of their approximate or accuracy in constructing phylogenetic trees.
The data are used to infer the evolutionary relationships and estimate the sequence of branching events that have occurred throughout history. In most cases, different computational algorithms and statistical methods, such as Maximum Parsimony, Maximum Likelihood, and Bayesian methods, are used to analyze the data and generate the most probable tree.
Interpreting a phylogenetic tree
Phylogenetic trees are read from the base upwards, with the base representing the common ancestor of all the taxa being studied. As you move up the tree, each branching point represents a divergence event, and the taxa located at the tips of the branches are the most recently evolved.
Also Read: Difference Between Homologous And Analogous Structures
Difference Between Cladogram And Phylogenetic Tree In Tabular Form
| BASIS OF COMPARISON | CLADOGRAM | PHYLOGENETIC TREE |
| Description | A Cladogram is a diagram used in cladiastics, it shows hypothetical relationships between groups of organisms. | A Phylogenetic tree is a diagram used to depict evolutionary relationships among organisms or group of organisms. |
| Components | A Cladogram consists of the organisms being studied, lines and nodes where those lines cross. | In a Phylogenetic tree, the species or groups of interest are found at the tips of lines referred to as branches. |
| Function | Cladograms are concerned with the way organisms are related to common ancestors through shared characteristics. | Phylogenetic trees compare organisms over evolutionary time and the amount of change that has occurred over time to figure out the relationships. |
| Basis | Cladogram is based on the morphological characters of the organisms. | Phylogenetic trees are based on morphological characters and genetic relationship of the organism. |
| Length | Cladogram is drawn with equal-length. The length of the branch does not represent an evolutionary distance. | Branch length of a Phylogenetic tree indicates the evolutionary distance. |
| Represents | Cladogram represents a hypothetical evolutionary history of organisms. | To some extend Phylogenetic tree indicates the true evolutionary history of organisms. |
| Nature | The shape of the Cladogram shows the relatedness among a group of organisms. | The distance of the branch depends on the amount of inferred evolutionary change. |
| Organization | Originally, Cladograms were organized based on morphological features but modern cladograms are more often based on genetic and molecular data. | Phylogenetic trees can be drawn in various equivalent styles. Rotating a tree about its branch points does not change the information it carries. |
| Relation Among Species | Cladograms have lines that branch off other lines. These branching off points represent a hypothetical ancestor (not an actual entity) which can be inferred to exhibit the traits shared among the terminal taxa above it. | In Phylogenetic trees, two species are more related if they have a more recent ancestor and less related if they have a less recent common ancestor. |