Linear and logistic regression are two common techniques of regression analysis used for analyzing a data set in finance and investing and help managers to make informed decisions. Linear and logistic regressions are one of the most simple machine learning algorithms that come under supervised learning technique and used for classification and solving of regression problems. There are two important variables in regression; they include dependent and independent variable. Dependent variable is the main variable you are trying to understand whereas independent variable comprises of factors that may have a significant effect on the dependent variable.
What Is Linear Regression?
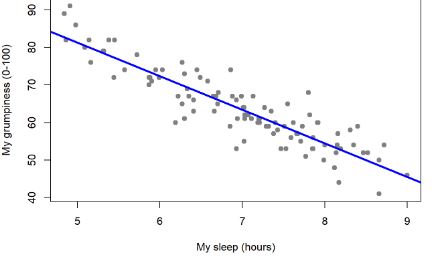
Linear regression is a technique of regression analysis that establishes the relationship between two variables using a straight line. Linear regression attempts to draw a straight line that comes closest to the data by finding the slope and intercept that define the line and minimizes regression errors. If a single independent variable is used for estimation of output, then analysis is referred to as Simple Linear Regression whereas if there are more than two independent variables used to estimate the output then such regression analysis is referred to as Multiple Linear Regression.
Multiple regression is a broader class of regressions that encompasses linear and nonlinear regressions with multiple explanatory variables. Multiple regressions are based on the assumption that there is a linear relationship between both the dependent and independent variables. It also assumes no major correlation between the independent variables.
Linear regression is one of the most simple machine learning algorithms that comes under supervised learning technique and used for solving regression problems. It is used in estimating the continuous dependent variable with the help of independent variables. This is done by finding the best fitting line that accurately predicts the outcome for the continuous dependent variable.
Application of Linear regression is based on Least Square Estimation Method which states that, regression coefficients must be selected in such a way that it minimizes the sum of the squared distances of each observed response to its fitted value. Due to the use of a straight line to map the input variables to the dependent variables, the output for linear regression is a continuous value such as age, price, salary, etc; and thus the output can be an infinite number. What this means is that, outputs can be positive or negative, with no maximum or minimum bounds.

What You Need to know About Linear Regression
- The purpose of Linear regression is to estimate the continuous dependent variable in case of a change in independent variables. For example, relationship between hours worked and your wages.
- Linear regression assumes normal or Gaussian distribution of dependent variable. Gaussian is the same as the normal distribution.
- Linear regression requires error term to be distributed normally.
- The output for linear regression must be a continuous value such as age, price, weight etc.
- In linear regression, the relationship between dependent variable and independent variable must be linear.
- Linear regression is all about fitting a straight line in the data. In this regard, it is done by finding the best-line of fit (fitting straight line) also referred to as regression line which is then used to estimate the output.
- Linear regression assumes that all residuals are approximately equal for all predicted dependent variable values.
- Betas or coefficients of linear regression interpretation is simple and straightforward.
- Linear regression is used for solving regression problem in machine learning.
- Application of Linear regression is based on Least Square Estimation Method which states that, regression coefficients must be selected in such a way that it minimizes the sum of the squared distances of each observed response to its fitted value.
- In the analysis of sample, linear regression requires at least 5 events per independent variable.
- Linear regression is a simple process and takes a relatively less time to compute when compared to logistic regression.
What Is Logistic Regression?
Logistic regression is a technique of regression analysis for analyzing a data set in which there are one or more independent variables that determine an outcome. It is one of the most popular Machine learning algorithms that come under supervised learning techniques. It can be used for classification as well as for regression problems.
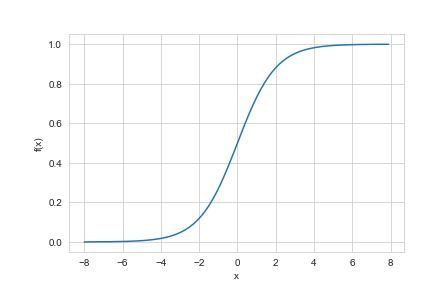
Logistic regression gives an output between 0 and 1 which tries to explain the probability of an event occurring. If the output is below 0.5 it means that the event is not likely to occur whereas if the output is above o.5 then the event is likely to occur. In essence, logistic regression estimates the probability of a binary outcome, rather than predicting the outcome itself. Logistic regression is also used in cases where there is a linear relationship between the output and the factors, in which case logistic regression will give a YES or NO type of answer.
Application of logistic regression is based on Maximum Likelihood Estimation Method which states that, coefficients must be selected in such a way that it maximizes the probability of Y give X (likelihood). It is also important to note that in logistic regression, we pass the weighted sum of inputs through an activation function that can map values in between 0 and 1. The activation function is commonly referred to as Sigmoid function and the curve obtained is called as Sigmoid Curve Or Simply S-curve.

What You Need to know About Logistic Regression
- The purpose of Logistic regression is to estimate the categorical dependent variable using a given set of independent variables. For example, logistic regression can be used to calculate the probability of an event. For example an event can be whether the business will still be a going concern or not in the next 12 month.
- Logistic regression assumes binomial distribution of dependent variable.
- Logistic regression does not require error term to be distributed normally.
- The output value of logistic regression must be a categorical value such as 0 or 1, Yes or No.
- In logistic regression, the relationship between dependent variable and independent variable is not necessarily required to be linear.
- Logistic regression, is about fitting a curve to the data, in this regard, it uses S-shaped curve to classify the samples. Positive slopes result in S-shaped curve and negative slopes result in a Z-shaped curve.
- In logistic regression, residuals are not necessarily required to be equal for each level of the predicted dependent variable values.
- In logistic regression, the coefficient interpretation depends on log, inverse-log, binomial etc, therefore it is somehow complex.
- Logistic regression is used for solving classification problems in machine learning.
- Application of logistic regression is based on Maximum Likelihood Estimation Method which states that, coefficients must be selected in such a way that it maximizes the probability of Y give X (likelihood).
- In the analysis of sample, logistic regression requires at least 10 events per independent variable.
- Logistic regression is an iterative process of maximum likelihood and there it requires a relatively longer computation time when compared to linear regression.
Difference Between Linear Regression And Logistic Regression In Tabular Form
| BASIS OF COMPARISON | LINEAR REGRESSION | LOGISTIC REGRESSION |
| Purpose | The purpose of Linear regression is to estimate the continuous dependent variable in case of a change in independent variables. | The purpose of Logistic regression is to estimate the categorical dependent variable using a given set of independent variables. |
| Distribution | It assumes normal or Gaussian distribution of dependent variable. | It assumes binomial distribution of dependent variable. |
| Error Term | It requires error term to be distributed normally. | It does not require error term to be distributed normally. |
| Output Value | The output for linear regression must be a continuous value such as age, price, weight etc. | The output value of logistic regression must be a categorical value such as 0 or 1, Yes or No. |
| Relationship Between Dependent And Independent Variable | The relationship between dependent variable and independent variable must be linear. | The relationship between dependent variable and independent variable is not necessarily required to be linear. |
| Aim | Linear regression is all about fitting a straight line in the data. In this regard, it is done by finding the best-line of fit (fitting straight line) also referred to as regression line which is then used to estimate the output. | Logistic regression, is about fitting a curve to the data, in this regard, it uses S-shaped curve to classify the samples. |
| Residuals | It assumes that all residuals are approximately equal for all predicted dependent variable values. | Residuals are not necessarily required to be equal for each level of the predicted dependent variable values. |
| Coefficient Interpretation | Betas or coefficients of linear regression interpretation is simple and straightforward. | Coefficient of logistic regression interpretation depends on log, inverse-log, binomial etc and therefore it is somehow complex. |
| Application | It is used for solving regression problem in machine learning. | It is used for solving classification problems in machine learning. |
| Basis Of Application | Application of Linear regression is based on Least Square Estimation Method | Application of logistic regression is based on Maximum Likelihood Estimation Method |
| Analysis Of Sample | In the analysis of sample, it requires at least 5 events per independent variable. | In the analysis of sample, it requires at least 10 events per independent variable. |
| Computation Time | It is a simple process and takes a relatively less time to compute when compared to logistic regression. | It is an iterative process of maximum likelihood and there it requires a relatively longer computation time when compared to linear regression. |